
IAPMO’S WATER DEMAND CALCULATOR IS PROVING ITS WORTH — IN DOLLARS AND BETTER HEALTH OUTCOMES — IN PROJECTS FROM COAST TO COAST
Citing research that reached as far back as 1921, Roy B. Hunter wrote, “It is hoped that this series of papers will supply the logical answer to many of the controversial questions pertaining to pipe sizes and design of plumbing construction.” But not content with such historic data, Hunter was leaning on the current research “on plumbing for low-cost housing.”
The current research from 1940.
From these origins were born the Hunter’s Curve, which for eight and a half decades has estimated the required pipe size to accommodate a building based on the number of fixtures. Since 1940, the sophistication of fixtures, including low-flow toilets, has greatly reduced that demand, leading to oversizing of pipes, bloating of installation and maintenance costs, and public health concerns synonymous with oversized pipes.
“How many other areas of modern life are still governed by thinking back from the 1940s?” asks Gary Klein of California-based Gary Klein and Associates, Inc.
In a 2024 presentation to the LA chapter of the American Institute of Architects Klein and IAPMO’s Christoph Lohr asked audiences if they were aware that “the formula from the 1940s for design flow rates assumes that every home operates like a sports stadium at half-time with queue lines to use fixtures.”
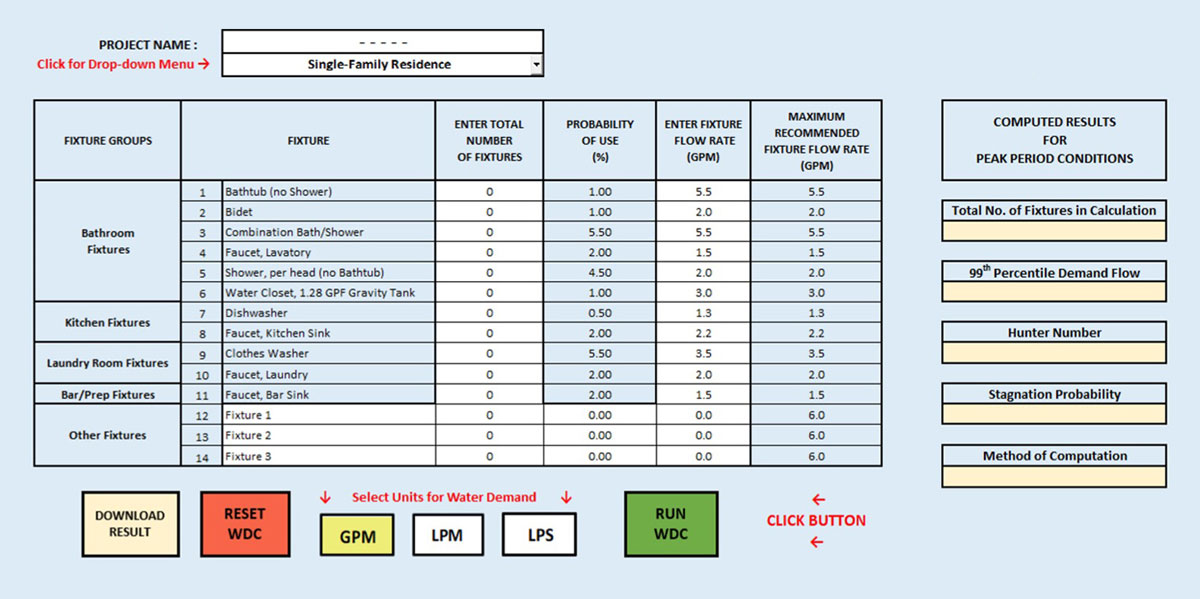
IAPMO released the Water Demand Calculator® in 2017 as part of its Water Efficiency and Sanitation Standard (WE•Stand) and the Uniform Plumbing Code (UPC®). Based on a Microsoft Excel platform, it draws from 10 years of contemporary data, delivering benefits to a variety of project types in virtually all regions of the country.
GRAPHIC COURTESY OF IAPMO
A refresh was ready. In 2017, IAPMO released the Water Demand Calculator® as part of its Water Efficiency and Sanitation Standard (WE•Stand) and the Uniform Plumbing Code (UPC®). Built on a Microsoft Excel platform, the Water Demand Calculator draws from 10 years of contemporary data, delivering benefits to a variety of project types in virtually all regions of the country.
One success story that Klein cites is Nueva Esperanza in Hillsboro, Oregon. Completed in 2023, the project’s 12 buildings include 150 units ranging from studios to four-bedrooms, on a six-acre parcel. The project saved an estimated $400,000 in capacity fees when local officials approved a 2-inch water meter based on Water Demand Calculator estimates, where Hunter’s Curve would have recommended a 4-inch meter. “This affordable housing property suddenly got a whole lot more affordable,” Klein says.
Early adopter Michael Rogers applied the calculator to Central Station in downtown Phoenix. The project’s two towers included one 22-story building with 655 beds of student housing, alongside a 33-story building with 362 units of residential housing. The complex arrangement also includes retail and office space that had to share space with an existing light rail system with significantly submerged easements, and a Metropolitan bus stop with “lots of people coming and going,” Rogers says.
“City officials had concerns of the level of discharge,” Rogers says of the dense development, which dominates a full city block. “The diversity factors were not
aligning to traditional calculations,” he says, but running various scenarios through the WDC eventually persuaded city officials to accept a reduced pipe fitting. Rogers describes a collaborative process with the municipality, trading scenarios and running them through the Water Demand Calculator. In the end, “There wasn’t a special slide, there wasn’t one long meeting,” Rogers says of the consensus eventually reached. “We weren’t trying to reinvent the wheel. We just wanted to understand what the wheel was going to do.”
In Portland, Oregon, the 12-story Julia West House will soon welcome formerly houseless elders and BIPOC individuals earning 30% or less median income to its 90 units. The calculator allowed John Lansing and the PAE team to install a 1-½-inch pipe rather than the 3-inch pipe for which Hunter’s Curve would have called. While there was no upfront savings in municipal charges — Service Development Charges were waived by the city for this project — Lansing counts amongst the project’s virtues a performance gain and a decreased risk of illness for the vulnerable resident population. A larger diameter pipe would have posed a greater risk of biofilm development, and increased danger from waterborne pathogens, including legionellosis.
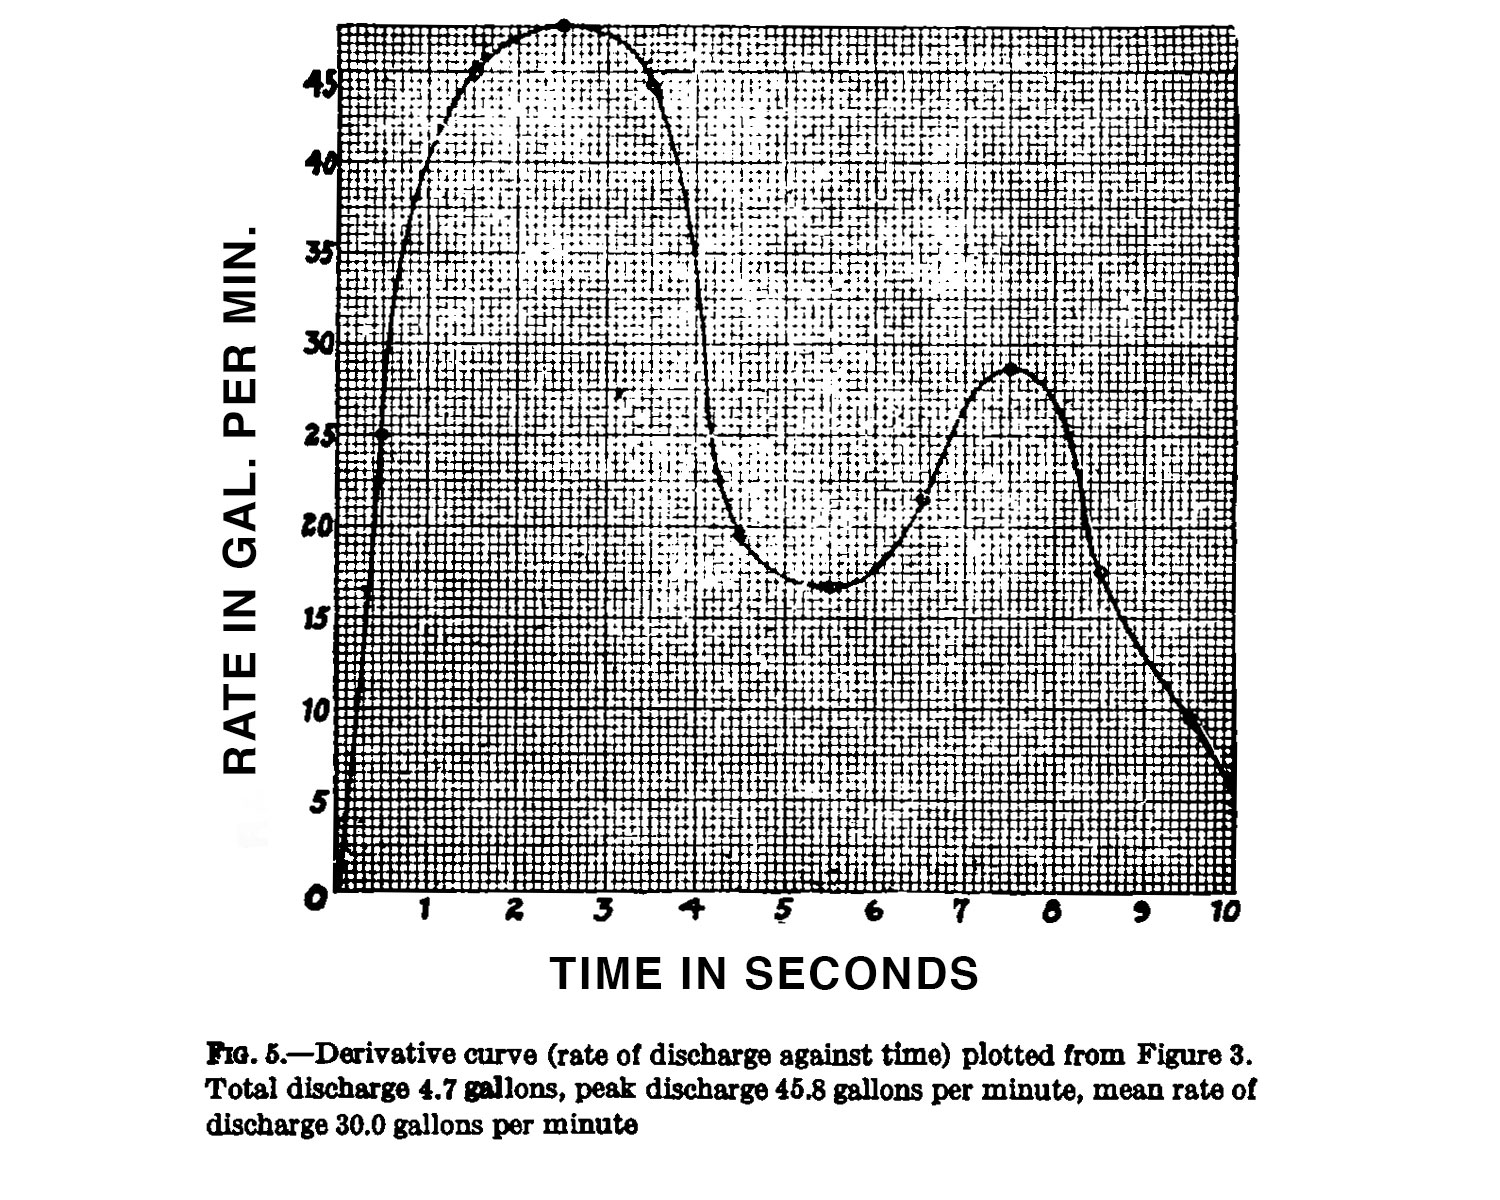
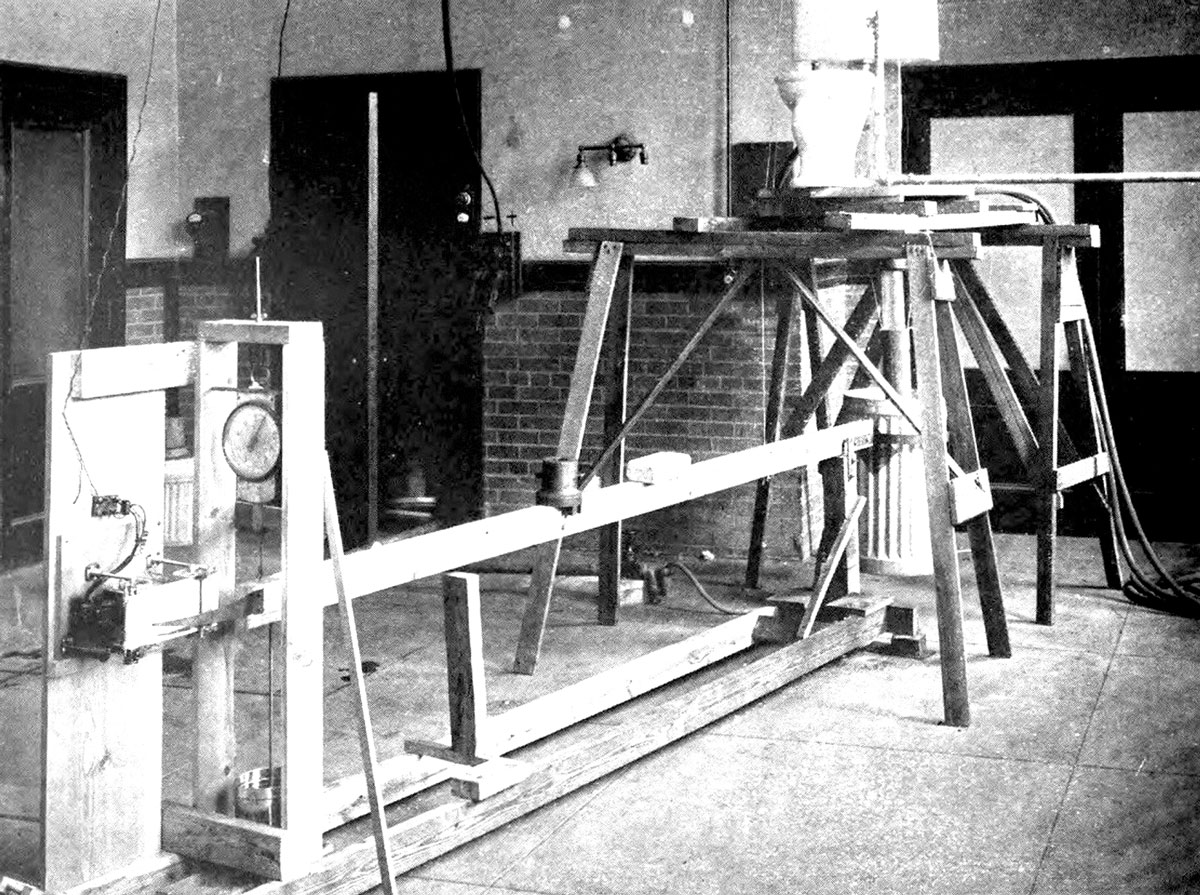
LEFT: Hunter’s fixture rating apparatus. RIGHT: A diagram by Hunter, which demonstrates the derivative curve.
Reducing the risk of Legionnaires’ disease in domestic water systems is covered in ASHRAE Guideline 12 and ASHRAE Standard 188, which calls for additional protections for certain occupancies. Lansing categorizes the Julia West House demographic to be at a higher risk than the average population.
“People who have lived on the streets carry undiagnosed or uncared for health issues,” Lansing says, citing for example the connection of unsheltered sleeping adjacent to busy roadways and freeways with asthma. “Housing is a foundational component of public health,” Lansing says. “There is extensive evidence linking people with asthma to higher risks of Legionnaires’ disease and unhoused people are 24% more likely to have asthma.
While single family homes may not have the same scalability to demonstrate impressive financial savings compared to large apartment buildings, WDC’s implementation in even the most basic housing design can affect beneficial shifts in behavior.
“Small diameter pipes allow shorter hot water wait times,” Lansing says. Residents are less likely to send water down the drain, waiting for a shower to heat up. “It’s an often overlooked aspect of where water waste happens.”
From his vantage in Napa, California, Todd Kuchta of J.W. McClenahan has seen the Water Demand Calculator at work in student housing, including a 14-story building where the 4-inch pipe called for by Hunter’s Curve would have been challenging to conceal in a long corridor.
On Treasure Island, another of Kuchta’s projects, a 20-story building has been sited on a former military installation. Water Demand Calculator calculations called for a 4-inch pipe where Hunter’s Curve would have called for as much as a 6-inch pipe, but Kuchta believes that a 3-inch pipe would have handled the flow just as well.
“We still overestimate how much we use toilets,” he says, explaining that Hunter’s Curve essentially estimated every toilet being used every four minutes in a 250-unit building. “With two people each using the toilet five times a day, that’s ten flushes over maybe a ten hour period. That works out to one flush an hour, and the Water Demand Calculator basically estimates one every 33 minutes.”
“Large statistics are not intuitive,” Kuchta continues. “The bigger the project, the more variance.” When asked how adaptable the calculator might be for future shifts in behavior, he advises, “We just went through a major change,” referencing COVID and months of a workforce stranded at home. When Hunter was writing his landmark tome, much of the workforce were employed in factories with set break times, supporting Hunter’s underlying estimates that large projects will have peak demand similar to that of a large football stadium. Today’s workforce is often hybrid, with staggered arrivals and departures; students in universities curate their class times to their convenience.
“We just don’t align our schedules in the way we used to,” Kuchta says. “Hunter knew he was being too conservative.”
Toward the end of his 1940 paper, Hunter admits that the results will be proven over time.
“The only complaint against the results of using this table and method that has come to the author’s attention is that it tends to give larger estimates than have been found necessary for satisfactory service,” Hunter wrote. “The proof of the adequacy of the proposed method of estimating the demand loads to be expected in building-water-supply systems will, in the end, depend on its success in actual trial over a period of years. Fortunately, in this case we have a means of comparison with a similar method that has been given a trial.”
In 2025, tools like the Water Demand Calculator can compare affordable housing, high-rises built for young professionals, student dormitories, and vacation housing
all with their varied water demands, and provide design that best fits their needs.

Matt Chapuran
Last modified: April 7, 2025